Do you read the NAM (National Association of Manufacturers) “Monday Economic Report”? It’s a valuable economic indicator for manufacturing. You can find it on the NAM website here. It’s free to access (you don’t have to be a NAM member) and a great item to add to your weekly reading list. Below is the Jan 8 report, the original can be found here. (AWFS is a member of NAM’s Council of Manufacturing Associations.)

| The Bureau of Labor Statistics reported that manufacturers added 25,000 workers in December, extending the strong hiring gains in the sector seen throughout much of 2017. Manufacturing employment rose by 16,333 per month on average in 2017—quite a turnaround from the loss of 16,000 workers per month in 2016. This is a sign that firms have stepped up their hiring as a result of a stronger economic outlook and increased demand and production activity. Indeed, since the end of the Great Recession, manufacturing employment has risen by 1,086,000 workers, with 12.54 million employees in the sector in this report. That is the highest level of manufacturing employment since January 2009.
Overall, manufacturing was one of the bright spots in the latest jobs report, with nonfarm payrolls up just 148,000 in December. That was below the consensus estimate of 200,000, and softness in other components, especially retail trade (down 20,300), pulled the headline number lower. Nonetheless, the labor market remains strong overall, with nonfarm payroll employment averaging 171,250 per month in 2017. That is a decent pace, even with some easing from the average rate of 186,667 in 2016. The unemployment rate remained unchanged at 4.1 percent for the third straight month, continuing to be its lowest level since December 2000. Beyond improvements in the global economy and overall activity, manufacturing optimism has risen to all-time highs largely due to a pro-business environment, including passage of comprehensive tax reform. Moving forward, manufacturers expect policymakers to address other initiatives, such as infrastructure, to keep the momentum going. Along those lines, the Institute for Supply Management’s (ISM) Manufacturing Purchasing Managers’ Index rose to its best reading since September’s 13-year high. Healthy gains in new orders boosted the headline ISM number, with that measure increasing at its fastest pace since January 2004. It was the seventh consecutive month that sales and production indices in the report exceeded 60, which would signify very spirited growth in demand and output in the sector. New factory orders rose 1.3 percent in November. The boost to orders in the latest data included large jumps in nondefense and defense aircraft and parts sales. Overall, new factory orders, which have struggled mightily over the past few years, have trended largely in the right direction more recently, up nearly 8.0 percent since November 2016, or 7.6 percent excluding transportation equipment sales. More importantly, core capital goods—or nondefense capital goods excluding aircraft—edged down 0.2 percent in November, but, much like the headline numbers, there was a healthy gain of 8.0 percent over the past 12 months. This is important as core capital goods are often seen as a proxy for capital spending in the U.S. economy. The trade picture has also been more encouraging, with the global economic outlook also improving notably of late. U.S.-manufactured goods exports increased more than 4 percent year to date through November 2017—a welcome turnaround from the declines in international demand in both 2015 and 2016. Nonetheless, the U.S. trade deficit rose to $50.50 billion in November, the highest level since January 2012. In the latest figures, the increase in the trade deficit stemmed mostly from a jump in goods imports that was more than enough to offset an increase in goods exports. At the same time, service-sector exports rose to a new all-time high ($65.66 billion), with the service-sector trade surplus edging up to $20.40 billion. One negative in the data last week was private manufacturing construction spending, which pulled back in November by 1.6 percent after inching up in both September and October. The value of construction put in place in the sector declined to $60.46 billion in November, its lowest level since September 2014. Construction spending in the sector has averaged $65.86 billion year to date in 2017, down from the average of $74.61 billion in 2016 as a whole. While manufacturing construction has trended largely higher over the past few years, activity has moved lower since achieving the all-time high of $82.13 billion in May 2015. Nonetheless, a turnaround in construction activity is expected in the coming months, especially in light of the improved outlook of late. This week, manufacturers will get a fresh look at manufacturing confidence regionally with survey data from the Philadelphia Federal Reserve Bank. It will be the first read on sentiment in the sector for 2018, which it is hoped will build on the strong gains in 2017. Likewise, the National Federation of Independent Business will release its latest Small Business Optimism Index figures for December, with respondents reporting their highest levels of enthusiasm in November in more than 30 years. In addition, the Census Bureau will provide retail spending numbers for the end of the year, including the all-important holiday sales. Even before that release, consumers had increased their purchases quite robustly, with retail sales up 5.8 percent year-over-year in November. Other economic highlights this week include new data on consumer credit, consumer and producer prices and job openings, and the NAM’s Global Manufacturing Economic Update will be released on Thursday. |
Last Week’s Indicators (Summaries Appear Below)Monday, January 1 Tuesday, January 2 Wednesday, January 3 Thursday, January 4 Friday, January 5 |
This Week’s IndicatorsMonday, January 8 Tuesday, January 9 Wednesday, January 10 Thursday, January 11 Friday, January 12 |
ADP National Employment Report
ADP reported that manufacturing employment remained a bright spot in December. The sector added 9,000 net new workers for the month, the sixth straight month of gains. As such, manufacturers continue to hire at a rather robust rate as firms react to increased activity and an improved economic outlook. The sector has hired an average of 17,738 employees per month in 2017—a significant turnaround from the more sluggish pace in 2016. Job growth is expected to remain strong for the foreseeable future. Overall, manufacturers continue to see signs that the labor market for the industry has tightened considerably, with business leaders citing notable challenges in attracting talent. In fact, workforce issues topped the list of business challenges in the most recent NAM Manufacturers’ Outlook Survey.
Meanwhile, total nonfarm private employment increased 250,000 in December, the fastest pace since March. Nonfarm private payrolls rose 211,791 per month on average in 2017, up from the monthly average of 180,892 in 2016. In December, the largest employment growth included professional and business services (up 72,000), education and health services (up 50,000), trade, transportation and utilities (up 45,000), leisure and hospitality (up 28,000) and financial activities (up 19,000). Small and medium-sized businesses (i.e., those with fewer than 500 employees) accounted for 77.6 percent of the net job growth for the month.
BLS National Employment Report
The Bureau of Labor Statistics reported that manufacturers added 25,000 workers in December, extending the strong hiring gains in the sector seen throughout much of 2017. Manufacturing employment rose by 16,333 per month on average in 2017—quite a turnaround from the loss of 16,000 workers per month in 2016. This is a sign that firms have stepped up their hiring as a result of a stronger economic outlook and increased demand and production activity. Indeed, since the end of the Great Recession, manufacturing employment has risen by 1,086,000 workers, with 12.54 million employees in the sector in this report. That is the highest level of manufacturing employment since January 2009. Moreover, the inability to attract and retain a quality workforce is one of manufacturers’ top concerns, which is further proof the labor market has tightened considerably.
Average weekly earnings for manufacturing workers edged down from $1,092.44 in November to $1,090.99 in December. That translated into 1.8 percent growth over the past 12 months.
In December, durable and nondurable goods employment rose by 21,000 and 4,000 workers, respectively. The largest increases included machinery (up 6,000), fabricated metal products (up 5,400), food manufacturing (up 4,500), computer and electronic products (up 3,000), primary metals (up 2,600), chemicals (up 1,900), nonmetallic mineral products (up 1,700) and motor vehicles and parts (up 1,300), among other sectors. In contrast, employment declined in December for petroleum and coal products (down 1,900), paper and paper products (down 1,200), printing and related support activities (down 1,100), apparel (down 700) and furniture and related products (down 700).
Overall, manufacturing was one of the bright spots in the latest jobs report, with nonfarm payrolls up just 148,000 in December. That was below the consensus estimate of 200,000, and softness in other components, especially retail trade (down 20,300), pulled the headline number lower. Nonetheless, the labor market remains strong overall, with nonfarm payroll employment averaging 171,250 per month in 2017. That is a decent pace, even with some easing from the average rate of 186,667 in 2016. The unemployment rate remained unchanged at 4.1 percent for the third straight month, continuing to be its lowest level since December 2000.
Construction Spending
The Census Bureau reported that private manufacturing construction spending pulled back in November, down 1.6 percent for the month after inching up in both September and October. The value of construction put in place in the sector declined from $61.46 billion in October to $60.46 billion in November, its lowest level since September 2014. Construction spending in the sector has averaged $65.86 billion year to date in 2017, down from the average of $74.61 billion in 2016 as a whole. While manufacturing construction has trended largely higher over the past few years, activity has moved lower since achieving the all-time high of $82.13 billion in May 2015. Nonetheless, a turnaround in construction activity is expected in the coming months, especially in light of the improved outlook of late.
Overall, private nonresidential construction spending increased 0.9 percent in November to its best reading since July; however, activity declined 3.1 percent over the past 12 months. In the latest figures, the data mostly rose for the month. Dollars spent on construction projects increased in the office (up 5.5 percent), transportation (up 3.7 percent), religious (up 3.2 percent), commercial (up 1.5 percent), amusement and recreation (up 1.4 percent), lodging (up 1.2 percent), educational (up 1.0 percent) and health care (up 0.1 percent) segments. In addition to reduced manufacturing construction spending, activity fell for power (down 1.1 percent) and communication (down 0.1 percent) projects.
Meanwhile, private residential construction spending increased 1.0 percent in November, with a healthy 7.9 percent year-over-year gain. In November, single-family construction rose 1.9 percent, but the multifamily segment fell 1.3 percent. Over the past 12 months, single-family construction spending grew 8.9 percent, but multifamily activity declined 1.7 percent year-over-year. In addition to those components, public construction spending edged up 0.2 percent in November, with a gain of 1.8 percent since November 2016.
Factory Orders and Shipments
The Census Bureau reported that new factory orders rose 1.3 percent in November, accelerating from the softer 0.4 percent gain in October. The boost to orders in the latest data included large jumps in nondefense (up 14.7 percent) and defense (up 12.4 percent) aircraft and parts sales. Aircraft orders can be highly volatile from month to month, and the November data include robust demand from the Dubai Airshow. Excluding transportation equipment, new orders for manufactured goods increased 0.8 percent, rising for the fifth straight month.
Overall, new factory orders, which have struggled mightily over the past few years, have trended largely in the right direction more recently, up nearly 8.0 percent since November 2016, or 7.6 percent excluding transportation equipment sales.
Looking specifically at durable goods activity in November, the data were mixed but higher on net. Demand increased for furniture and related products (up 1.6 percent), motor vehicles and parts (up 1.1 percent), primary metals (up 0.9 percent) and electrical equipment and appliances (up 0.6 percent). In contrast, orders declined for machinery (down 1.0 percent), computers and electronic products (down 0.5 percent) and fabricated metal products (down 0.2 percent). Core capital goods—or nondefense capital goods excluding aircraft—edged down 0.2 percent in November, but, much like the headline numbers, there was a healthy gain of 8.0 percent over the past 12 months. This is important as core capital goods are often seen as a proxy for capital spending in the U.S. economy.
Meanwhile, shipments of manufactured goods increased 1.2 percent in November, up for the seventh straight month. Durable and nondurable goods orders increased 0.9 percent and 1.4 percent, respectively. On a year-over-year basis, factory shipments have risen 7.3 percent since November 2016, or 7.6 percent excluding transportation.
International Trade Report
The Bureau of Economic Analysis and the Census Bureau reported that the U.S. trade deficit rose from $48.91 billion in October to $50.50 billion in November, the highest level since January 2012. In the latest figures, the increase in the trade deficit stemmed mostly from a jump in goods imports (up from $199.41 billion to $205.46 billion) that was more than enough to offset an increase in goods exports (up from $130.18 billion to $134.57 billion). At the same time, service-sector exports rose to a new all-time high (up from $65.60 billion to $65.66 billion), with the service-sector trade surplus edging up from $20.32 billion to $20.40 billion.
Despite the uptick in the trade deficit data, manufacturing exports continue to trend in the right direction. Using non-seasonally-adjusted data, U.S.-manufactured goods exports totaled $999.84 billion year to date in November, up 4.19 percent from $959.65 billion one year ago. This reflects better year-to-date figures to the top-six markets for U.S.-manufactured goods: Canada (up from $245.70 billion to $259.19 billion), Mexico (up from $210.65 billion to $223.27 billion), China (up from $103.92 billion to $116.70 billion), Japan (up from $57.58 billion to $61.26 billion), the United Kingdom (up from $51.00 billion to $51.53 billion) and Germany (up from $45.00 billion to $48.61 billion).
The underlying goods exports data were mostly higher, led by increased exports for non-automotive capital goods (up $2.47 billion). Other gains in goods exports included automotive vehicles, parts and engines (up $963 million), consumer goods (up $662 million), industrial supplies and materials (up $240 million) and foods, feeds and beverages (up $112 million). At the same time, as noted above, goods imports also rose sharply in November, including for consumer goods (up $2.39 billion), industrial supplies and materials (up $2.18 billion) and non-automotive capital goods (up $1.58 billion).
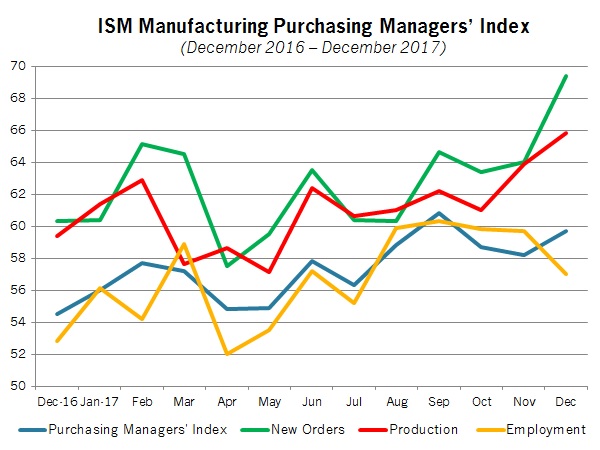
ISM Manufacturing Purchasing Managers’ Index
The Institute for Supply Management (ISM) reported that manufacturing activity expanded robustly in December, with new orders increasing at the fastest pace since January 2004. The ISM Manufacturing Purchasing Managers’ Index rose from 58.2 in November to 59.7 in December, its best reading since September’s 13-year high (60.8). Healthy gains in new orders (up from 64.0 to 69.4) boosted the headline number. It was the seventh consecutive month the sales measure has exceeded 60, which would signify very spirited growth in demand. In addition, exports also experienced strong growth in December (up from 56.0 to 58.5). Indeed, the sample comments tended to echo the optimistic outlook, citing strong U.S. and global sales for the sector.
Looking at other key measures in the report, production (up from 63.9 to 65.8), supplier deliveries (up from 56.5 to 57.9) and imports (up from 54.5 to 57.5) also increased more briskly in December. Similar to new orders, the production index has exceeded 60 since June. With that said, employment slowed somewhat in the latest data (down from 59.7 to 57.0), even as hiring remained at healthy rates overall. In general, the labor market has tightened considerably, with the employment index averaging 59.3 over the past five months, up from a more modest 52.8 one year ago.
Meanwhile, prices for raw materials have remained highly elevated (up from 65.5 to 69.0), with the measure up 3.5 percent from November’s level. This reflects a rebound in some commodity costs, even as overall pricing pressures have remained modest. In other news, inventories contracted for the third straight month (up from 47.0 to 48.5). This could indicate stronger production in the months ahead, however, especially with the enthusiastic demand figures discussed above.